I have struggled with the reporting of the AstraZeneca Covid vaccine giving rise to blood clots.
Not because I am wary of the vaccine. On the contrary, I’m conflicted because there’s a good argument that the blood clot risk should have not have been reported at all.
There is a higher chance that the earth will be hit by a big asteroid (1-2km in diameter) this year than you dying from the AstraZeneca vaccine should you choose to be vaccinated. But plenty of people I know are “waiting to see what happens” before getting their vaccination, while I don’t know anyone preparing for the end times.
Because I am not a superstitious person, and because I wanted to know the relative risks of things, I went to the Australian Bureau of Statistics and worked out that I have 6800 times the chance of dying from something other than the Covid vaccine this year. And the odds of me dying from any cause are actually very small, less than 1 percent. The AstraZeneca risk is 6800 times less than that. Language and imagination fail us when we get to these numbers.
This vaccine blood clot risk exists but it isn’t, or shouldn’t be, a consideration. For me this raises the uncomfortable question of whether reporters and editors had a responsibility to ignore blood clots entirely. Uncomfortable because it’s patronising and goes against everything I usually believe about freedom of information. A question in the first place because I know that for many people “waiting to see what happens”, my framing of the risk in asteroid terms won’t change a thing. Vaccination is voluntary, asteroids are not. Who willingly accepts a deadly risk?
All of us, it turns out. Before I go into that, I want to talk some more about numbers.
Journalism and statistics come from different worlds
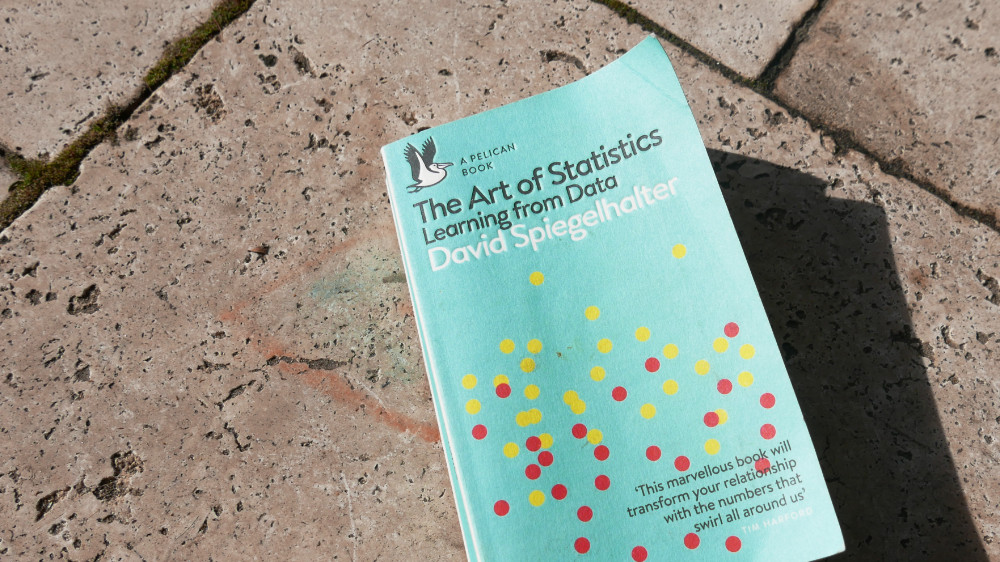
The Art of Statistics, by David Spiegelhalter, is compulsory reading for anyone in media. I picked the book up by chance, and couldn’t stop. In the space of a few pages, Spiegelhalter tantalises with the case of serial killer doctor Harold Shipman before veering to the apparently unrelated “How many trees are there on the planet?” Then he’s off, investigating children dying in hospital and the number of sexual partners in a lifetime.
The book makes it clear that while journalism and statistics are married, the union is not a happy one. The tension exists because they come from different worlds: statistics usually deals with big groups and generalisations, journalism is at its best telling individual stories. As every editor knows, the most engaging way to tell general truths is through people who represent those truths.
On top of this natural tendency, journalists tend to wilfully abuse statistical concepts in order to manufacture the best story. For example, only reporting relative risk increase, rather than absolute increase, results in exaggerations: “Eating a bacon sandwich every day increases your risk of bowel cancer by 18%”. But that is the relative increase in the small group of people who get bowel cancer, from 6% to 7% of the population. The absolute risk increase of eating bacon every day is 1%.
In many cases, journalists are the willing dupes of press officers in these exaggerations and misrepresentations. Spiegelhalter, who is the president of the Royal Statistical Society, is actually fairly kind to news media in the book, and lays most of the blame for poor stories on scientists desperate for significant results and publicity.
I do not share Spiegelhalter’s generosity. In every newsroom I have worked in I have seen complicity with obviously crap studies and dodgy numbers, and for transparent reasons. Who wants to kill a good story through a rigorous look at the methodology? Who are we to question scientists?
For many journalists, I suspect that underconfidence with numbers combines with this desire for a good story. For my part, I learned a great deal I should have already known from reading The Art of Statistics.
- That “average” can mean any one of three things
- What “significance” means in a scientific study, and that lower numbers (P numbers) indicate stronger findings
- That the finding of “significance” in scientific studies can be effectively manufactured by running many studies and only reporting the significant findings
- That margins of error should always be reported
Among other things, knowing statistics allows us to understand the causes of “the replication crisis” in psychology, medicine and the social sciences. If you haven’t heard of it, this is the alarming discovery that many studies over decades are “not replicable”. In other words, many of the stories scientists have been telling us, and we have been telling ourselves, are bunkum.
I won’t say the book is all easy reading, and there were several later sections where I did not sufficiently grasp the technical meaning of terms to recall them for later use. But this is important stuff, and if big decisions are being made and beliefs being formed, it’s worth putting a little time into understanding the numerical basis of scientific claims.
Everything in perspective
To bring it back to the AstraZeneca vaccine, there have been some great examples of simple statistical comparisons that have put the smallness of the risk in perspective. Inspired by Spiegelhalter I have done my own research into relative risks to compile the table below. The point is, we knowingly accept potentially fatally risks at every moment. It is not possible to live and do otherwise.
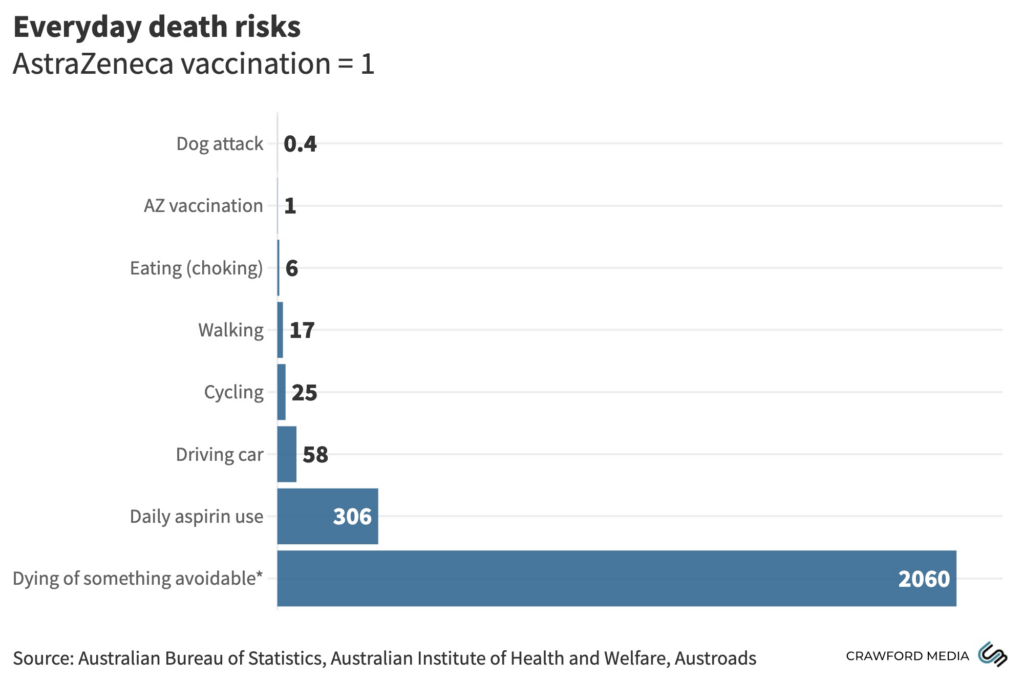
The table does need a bit of explaining. All risks are the risks of dying in a year (not a day), and are mostly based on 2019 data from Australia. The exception is the base AZ risk (understood currently to be 1 in 2 million) and the aspirin risk, which is taken from the American Journal of Gastroenterology in 2005. Choking here relates to the whole population but in reality, the very young and very old are those at greatest risk of choking, so the risk is exaggerated for everyone else. Conversely, not everyone drives a car, so risks for those who actually get in cars are higher than the number indicated. The cycling number should be more accurate, with the number of cyclists taken from Austroads.
You can see that “Dying of something avoidable”, which is an Australian Government classification for people under 75 who die from accidents, suicide, crimes or preventable diseases, far outweighs other considerations. It’s still a very small risk. Whether this reassures you or just adds to your general level of anxiety is up to you.
Proof point: Asteroids and AstraZeneca
As stated, deaths linked to adverse reactions to the Astra Zeneca vaccine average 1 for every 2 million vaccinations. If you think that is worth taking into account, consider the following (old but still apparently valid) advice from NASA:
… the working group concluded that an impact by an asteroid larger than 1-2 kilometers could degrade the global climate, leading to widespread crop failure and loss of life. Such global environmental catastrophes, which place the entire population of the Earth at risk, are estimated to take place several times per million years on average.
An occurrence that happens, say, once every million years has a 1 in a million chance of happening this year. Which makes it twice as likely as dying from an AstraZeneca blood clot.
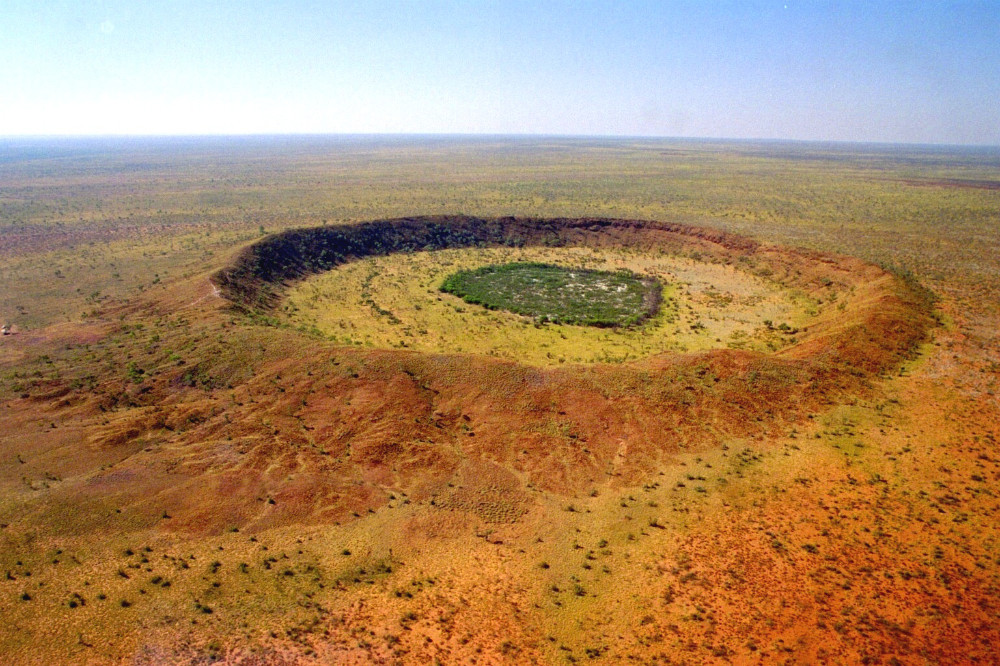
The Wolfe Creek Crater in Western Australia, above, demonstrates that big asteroids do occasionally strike. This wonderful photograph was taken by Dainis Dravins, of the Lund Observatory, Sweden. Professor Dravins graciously allowed me to use his photo, and as an aside told me he has safely received both doses of the AstraZeneca vaccine.